Today’s European private car market is a complex and dynamic landscape following several challenging years. Manufacturers have been battling pandemic disruption, chip shortages, and geopolitical turbulence, whilst simultaneously facing increased uncertainty from electrification and CO2-related regulation with worldwide implications.
Taking a closer look at the macro-level trend analysis of prices from the last seven years, it presents an interesting perspective on what is happening in the market, what risks to consider, and potential opportunities in the ongoing market. Looking at Germany, France, Italy, and the UK as a whole aggregated multi-country market, the trajectories by segment reveal possible implications for consumers who must deal with rapid, substantial changes.
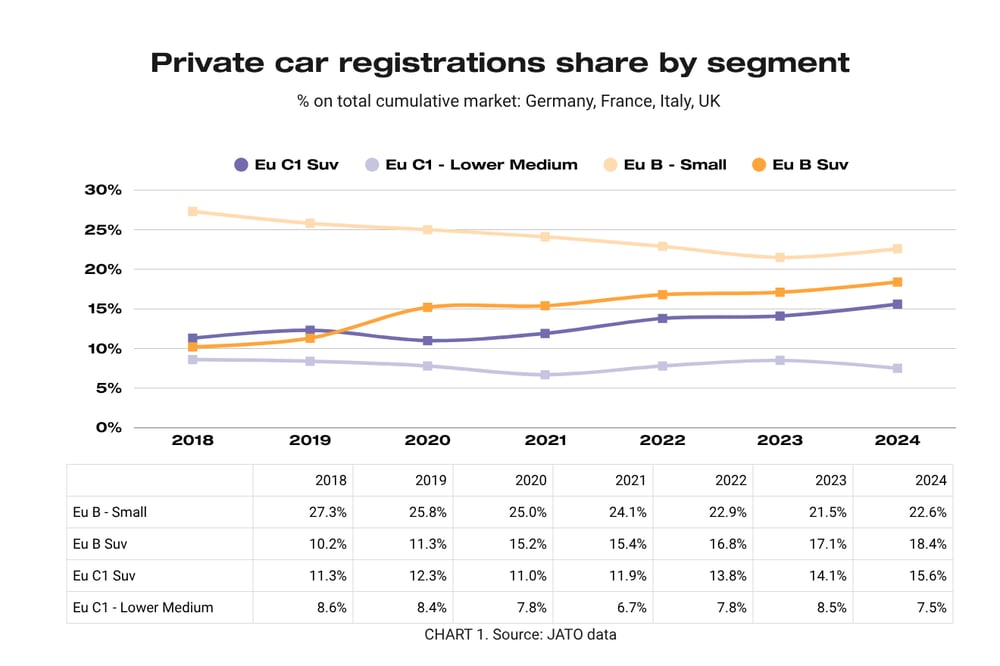
Share by segment
Over the last seven years, four key segments have dominated the aggregated European private car market accounting for approximately 60% of total registrations: B-segment, B-SUV, C1-segment, and C1-SUV (Graph 1).
These segments are critical not just for their volume, but because they've been at the centre of the industry's biggest disruptions. The SUV boom has reshaped body-type preferences, whilst traditional estates and saloons have lost ground. Simultaneously, the diesel decline, and rapid electrification have fundamentally altered powertrain mix and manufacturing costs.
Each of these shifts has affected pricing differently across the four countries and segments analysed, creating the complex price dynamics explored in this analysis.
Year-on-year perspective
By measuring price growth from a year-on-year perspective, the years 2020-21-22 registered the highest overall increases and respective peaks for most of these segments (Graph 2).
• B Small, the segment with the highest volumes, shows its peak in 2020 and has the highest increase in that year: +10% versus 2019, equal to about +€1,800. In percentage terms, this is a three times higher price increase versus the one of 2019 versus 2018 (which had been +3%). In 2020, the other segments considered here also show a higher increase versus the previous year but the percentage of increment is not comparable to what was registered by B Small.
• C1 – Lower Medium reaches the highest peak within these segments in 2021 and its own highest increase versus the previous year: +12% versus 2020, equal to around +€3,500. This is also the highest increase within these segments in the entire considered seven-year period and equals the cumulative price increase of the previous two years. In absolute values, the cumulative increase of the previous two years is even lower, equal to €3,300. In following years, this segment never exceeds a yearly +4%.
• C1 SUV displays the highest increase in 2022 within these segments and its own peak: +10% versus 2021, equal to about +€3,100. This represents the third consecutive year of growing price increase versus the previous year, following +4% and +7%, and is the last clearly peaking increase by segment in the considered period.
• B SUV does not display any evident peak in the three years, and its increase is constant as a percentage between 6% and 7%, progressively growing in absolute values from €1,500 to €2,000 per year.

Trend analysis
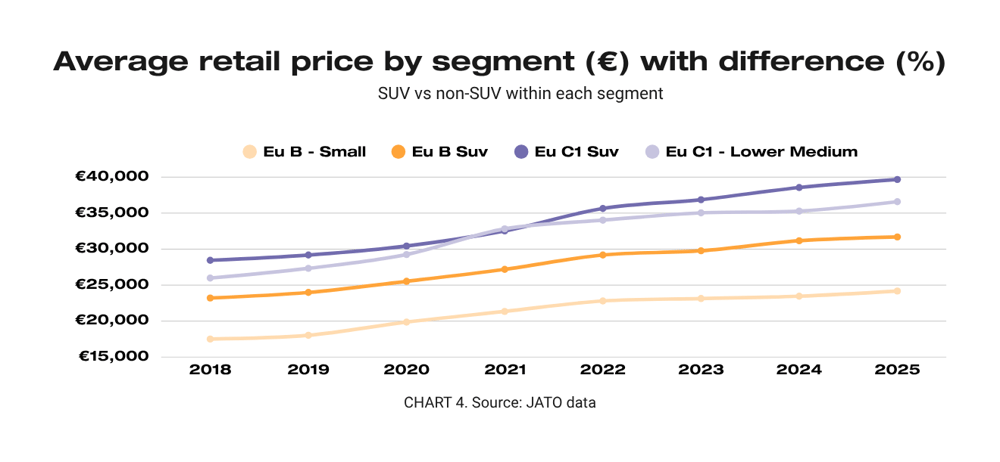
Comparing 2018 with 2024 reveals the scale of European price increases: average retail prices surged by 34% for B-segments and 36% for C1-segments across Germany, France, Italy, and the UK (Graph 3).
In absolute terms, C1-SUV experienced the steepest increases at approximately €10,100, whilst B-segment small cars saw the smallest rise at €5,900. However, the data shows that all segments followed remarkably similar trajectories, with the steepest price acceleration concentrated between 2020 and 2022. This parallel movement across segments suggests industry-wide cost pressures and profits preservation measures, rather than segment-specific factors, drove these unprecedented increases.

Price differences within macro-segments and body-clusters
The price gap between SUVs and traditional body styles within each segment tells an interesting story. Starting from the expected baseline that SUVs command higher prices, both B and C1 segments have seen their price differentials fluctuate significantly during the analysis period.
By 2024, the percentage price gaps have largely returned to pre-2020 levels. Yet, both segments experienced a notable squeeze-and-stretch pattern between 2020-2022, where price differentials first narrowed then widened again, each with distinct characteristics.
Graph 4 reveals the following patterns:
- Within B segments, the price premium for SUVs over traditional models fluctuates between 27% and 33%. The gap followed a predictable pattern: narrowing through 2020-2021 (reaching its smallest point in 2021), then widening back to 2018-19 levels by 2024. However, whilst the percentage gap has returned to historical norms, absolute values tell a different story. In 2024, B-SUVs cost €7,700 more than B-segment small cars, compared to just €5,700 in 2018. Notably, B-segment price differentials are both larger and more consistent than those in C1.
- Within C1 segments, SUV premiums are far smaller, ranging between just 9% and -1% – remarkably, the premium briefly disappeared entirely in 2021. This represents a much wider swing of 10 percentage points compared to B-segment's more stable pattern. Like B-segments, percentage gaps have returned to pre-2020 levels, but absolute differences have grown: C1-SUVs now cost €3,300 more than C1 traditional models, up from €2,500 in 2018.
Comparing across segments by body type (Graph 5):
- Within the SUV category, C1-SUVs maintain a 19-24% premium over B-SUVs. This gap narrowed during 2019-2021 but has since widened beyond pre-2020 levels. In absolute terms, the increase is stark: C1-SUVs now cost €7,400 more than B-SUVs, compared to €5,200 in 2018.
- Within traditional body styles, the segment gap is much larger and more stable, ranging between 47-54%. The difference has grown from €8,500 in 2018 to €11,800 in 2024.

The data reveals a critical insight for OEMs. Whilst percentage price premiums have returned to pre-pandemic norms, the cost barriers between segments and body types have permanently escalated. It creates new competitive dynamics where traditional segment boundaries are under pressure, potentially reshaping customer migration patterns and brand positioning strategies.
The price migration phenomenon
The analysis reveals a striking market dynamic: today's compact models cost what mid-size variants did just years ago. This "price migration" effect demonstrates how inflation and external factors have fundamentally shifted the European market landscape.
The pattern is clear. As prices rise across all segments, lower-tier models reach the price points that higher-tier models occupied in recent years. Most notably, B-segment traditional cars now cost what B-segment SUVs did in 2018-2019, whilst C1 traditional models have reached 2021-2022 C1-SUV pricing levels (Graph 6).
Key findings:
- Within B-segments: Traditional models have "caught up" to 2018-19 SUV pricing, a five-year migration period.
- Within C1-segments: Traditional models reached 2021-22 SUV pricing, just a two-year migration period.
The data reveals an important insight: the larger the initial price gap, the longer the migration period. B-segments, with their substantial 27-33% SUV premiums, required five years for price convergence. C1-segments, with minimal 9% to -1% gaps, saw convergence in just two years.

SUV prices are shifting across different size categories (Graph 7). In 2024, a B SUV costs the same as a C1 SUV did in 2020-2021. The smaller SUV caught up to the larger one's price in about 3-4 years, essentially eliminating the €5,000 price gap that existed in 2020. Non-SUV cars didn't show this same price convergence during this period, partly because the price difference between B Small and C1 Lower Medium cars was larger to begin with.

The price differences between 2018 and 2024 reveal some notable trends:
- By segment, within B and C prices grew roughly by 34% and specifically:
- between B Small and B SUV, from €5,700 to €7,700.
- between C1 Lower Medium and C1 SUV, from €2,500 to €3,300.
- By body-cluster, between B and C1 prices grew by 40% and specifically:
- between B SUV and C1 SUV, from €5,200 to €7,400.
- between B Small and C1 Lower Medium, from €8,500 to €11,600.
What this means for OEMs
The analysis reveals a widening price spread between the cheapest and most expensive vehicles within the segments examined, with full 2025 data still pending.
These findings extend beyond simple price comparisons, offering deeper insights into market absorption patterns and affordability dynamics. They provide a foundation for understanding broader trend implications and enable further market analysis.
Given the significant country-to-country variations within this four-market view, these insights help assess potential customer impacts across two key dimensions: purchase behaviour (including alternative mobility solutions, financing versus cash purchases, and ownership versus usage models) and vehicle selection (segment and type preferences).
How JATO can help
JATO delivers comprehensive automotive market intelligence. Our expert analysts provide tailored insights using real-world transaction data—including discounts and actual selling prices—to reveal deeper affordability trends. With JATO Advisory's data-driven approach, OEMs make strategic decisions that keep them competitive in rapidly evolving markets. Learn more about JATO Advisory (https://www.jato.com/our-capabilities/jato-advisory)
Notes of methodology
Database considered is JATO Model Mix sourced by JATO Incentives Navigator standard tool. Partial and not complete data are used for 2025, based on what is currently available when the analysis is run and waiting for full year completion.
Segments are defined as per standard JATO Segmentation and, specifically, C1s does not include premium brands.
The data represented here refers to retail price (list price) of units registered to private customers in the covered perimeter. What is reported is the average retail price weighted on volumes. Because of this, it is worth clarifying the analysis does not purely track the price of orderable (offered, available) vehicles but the price of vehicles that have been effectively registered in the considered period. It means that prices and changes/trends/differences represented here are driven not only by effective list price change but also by a mix effect due to vehicle volumes concentration/shift/share etc. For enabling a multi-country analysis, values for Great Britain are converted to Euro.
JATO Advisory. Your trusted industry voice.