
In 2025, California is on pace to see declining BEV (battery electric vehicles) sales for the first time since the pandemic affected the market in 2020, a sign that the leader of the United States’s electric vehicle movement might be getting to the point of saturation. Signs of growth are still evident across fellow “ZEV” (zero emissions vehicles) states which have also seen rapid growth in the past five years. BEV adoption is also on the rise in other parts of the country. Through September 2025, non-ZEV states grew BEV sales by 26.5% year-over-year compared to ZEV states at 4.1%.
This analysis covers data through September 2025, the final month before national incentive changes took effect, offering a snapshot of the market before a major policy shift.
ZEV regulations: A 35-Year foundation
Since 1990, California's Air Resources Board (CARB) has set the standard for electric vehicle policy through ZEV regulations. Today, 17 states plus the District of Columbia follow these requirements.
Automakers selling vehicles in ZEV aligned states must achieve minimum EV credit percentages, with credits tradable between manufacturers. This creates a two-tier market where manufacturers prioritise ZEV states for EV launches and inventory allocation. The result is distinct distribution strategies and product availability that varies between states.
The numbers tell the story
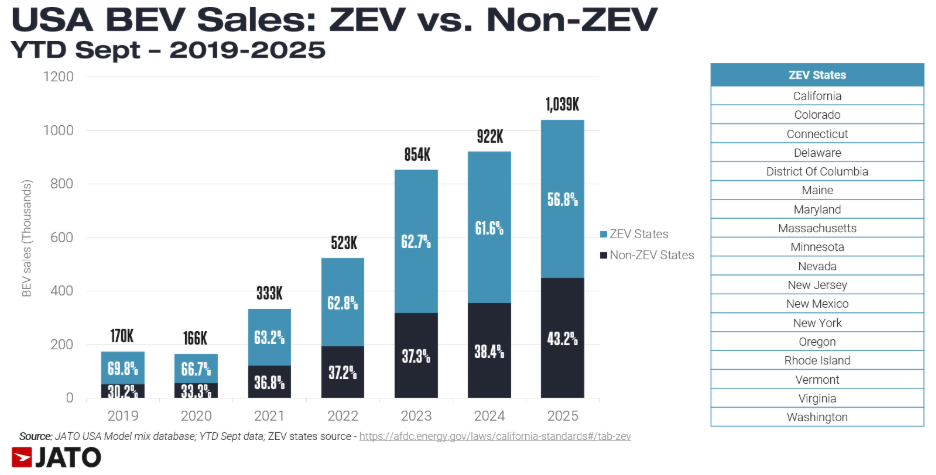
ZEV states still dominate BEV sales volumes. Through September 2025, these states accounted for 57% of new BEV sales despite representing only 35% of the US population and 36% of new vehicle sales. However, as previously mentioned, non-ZEV states posted 26.5% year-over-year growth versus 4.1% in ZEV states.
The early adopter markets are maturing, and that matters for automakers planning product strategy and distribution networks. ZEV states will continue to drive BEV volume, maintaining their role as the backbone of the electric vehicle market even as their growth rate slows. However, if BEV sales can sustain their momentum in the non-ZEV states (or more states start to follow ZEV regulations), then it will be a great opportunity for automakers, especially domestic brands like Ford and Chevrolet which continue to have strong holds within the Southeast and Midwest United States.
State-level performance
Despite having a year-over-decline, California remains the leader with 21% BEV market penetration. More telling is how the benchmark has shifted. In 2022, California was the only state exceeding 13% penetration which is now the average for ZEV states.
Five states and the District of Columbia now meet or exceed this threshold:
- California: 21%
- District of Columbia: 19%
- Colorado: 19%
- Washington: 17%
- Nevada: 16%
- Oregon: 13%
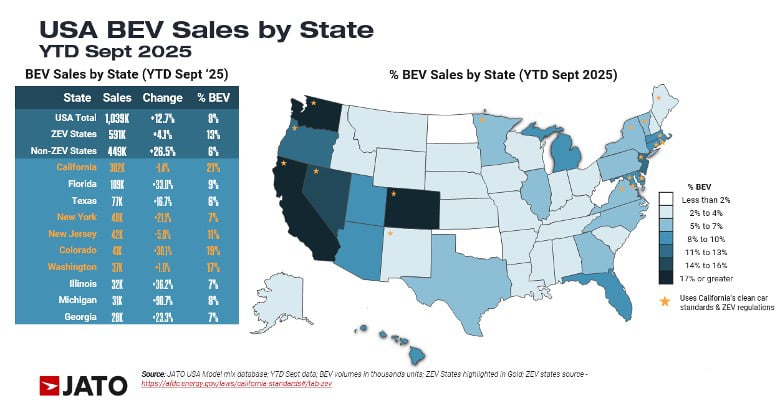
The non-ZEV states show where the momentum is with the 2nd and 3rd biggest US markets for vehicle sales seeing notable growth. Florida hit 109k BEV sales, up 33.0% year-over-year. Texas reached 77k sales with 16.7% growth, closely matching the penetration rate of the second largest ZEV state, New York (6% vs. 7%). BEV sales in Michigan also jumped 90.7% year-over-year, breaking into the top ten states for BEV sales.
The infrastructure divide
Public charging infrastructure explains some of the performance gap between these two groups. Non-ZEV states have significantly fewer charging points available. On average, 2,216 people share each public charging point compared to 880 in ZEV states. That translates to 2.5 times less charging availability, creating a structural disadvantage that directly impacts consumer confidence and purchase decisions. For drivers in non-ZEV states, finding an available charger is simply harder, particularly in suburban and rural areas where charging infrastructure is thinnest.
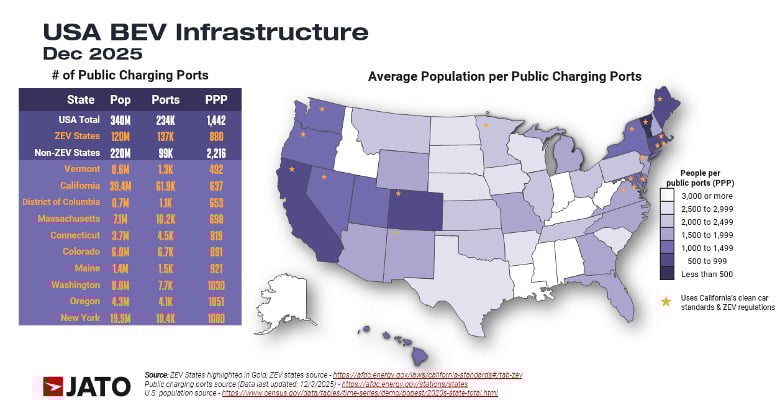
ZEV states hold 14 of the top 15 positions for charging accessibility. Utah at 14th, with 1,246 people per charging point, is the only non-ZEV state in this group, sitting between Maryland and Nevada.
Charging accessibility remains one of the top factors in purchase decisions, alongside government incentives, range anxiety, and charging times. Infrastructure gaps create real barriers to adoption.
What comes next?
2026 data will be telling. National incentives have ended, and Q4 2025 sales saw an expected decline. The question is whether consumers accelerated their purchase timelines to capture expiring benefits. In other words, did buyers and lessees move forward purchases they were already planning, pulling them into Q3 to take advantage of tax credits and manufacturer discounts before they disappeared? Or is this the start of something more fundamental? We'll be tracking this closely and reporting in our future articles.
Range anxiety and charging times are increasingly becoming perception issues rather than technical ones. Current BEV models average around 300 miles of range and can fast charge from 10% to 80% in under 30 minutes. Closing the gap between capability and consumer confidence is the next challenge for the industry.
Partner with JATO Advisory
Understanding market trends is one thing. Knowing what they mean for your specific business is another. JATO Advisory brings 40 years of automotive expertise and real-time global data to help manufacturers, suppliers, and dealers make strategic decisions with confidence.
Whether you're evaluating regional strategies, optimising product portfolios, or planning for regulatory changes, our analysts can help you cut through the noise.
Book a call with our experts to discuss your priorities and how JATO's data can support them.